


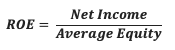
The DuPont Analysis tool assesses the ability of a company to improve its Return on Equity (ROE), which measures the profitability of a business with respect to equity. The analysis came up as a blessing for investors and financial analysts as it helps them decompose the factors leading to profits and thereby enhance the same for better performance in the future.
Explanation
DuPont Analysis helps a business be aware of the contribution of each part of the ROE in determining its growth and profitability. Therefore, it is considered the fundamental tool for a performance assessment that analyses different parameters and factors affecting investor returns.![]()
For example, when the net profit margin of a company is more, it is difficult to say whether it is the increased revenue that has led to the enhanced profits or reduced expenses or costs. DuPont Analysis is the technique that can help a business identify the contribution of revenue and expenses individually to assess their performance separately. As a result, companies get an opportunity to improve the performance of all individual factors accordingly.
The Components
The Return on Equity on which the entire DuPont Analysis is based is divided into the following components:
Profit Margin
Net Profit Margin is the ratio of net sales to revenue. It is the measure of the profitability of a business.
![]()
The profit margin of a business is affected positively by either the decrease in the owner cost or the increase in the prices. This is why the volatility of stocks of a particular company fluctuates with the change in its costs, prices, or other guidelines.
Asset Turnover
Asset turnover measures the efficiency with which businesses utilize assets to generate revenue.
![]()
This ratio helps assess the performance of two companies having similar characteristics.
Financial Leverage
Financial leverage is a liquidity ratio that indicates the total capital being funded by shareholders and by debt. It is expressed as:
Where,
Equity = Assets – Liabilities
The Models
The Dupont analysis models are available in three forms. All three forms, however, are derived from the very basic ROE expression:
Three-Step Model
The three-step model can be derived from the above equation by multiplying Asset Turnover and Financial Leverage Ratios.
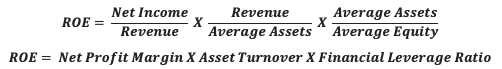
Thus, the Three-Step DuPont Analysis indicates that when the ROE of a company is high, it is either because of the increase in the Net Profit Margin Asset Turnover or increased debt capital.
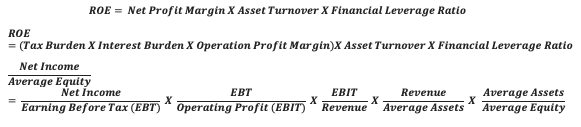
Five-Step Model
The Five-Step model is derived from the two-step model formula of ROE, i.e.:
Example with Calculation
Let’s say DuPont Analysis is to be used to check which company between A and B is performing better. Which one is a better performer?
To do so, here are the details to know, which have already been shared:
Company ACompany BNet profit margin = 35Net profit margin = 28Asset Turnover Ratio = 0.5Asset Turnover Ratio = 0.5Financial leverage ratio = 0.8Financial leverage ratio = 1
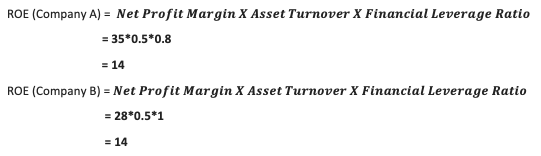
Example Answer: Though the ROE of both the companies is the same, the DuPont analysis still helps to figure out the better performer, which is company A in this context. Why?
Answer Explanation: Net Profit Margin of Company A is better than B and requires LOWER leverage than Company B to complete. Hence it can be concluded that with even lower leverage, Company A performs better


1 Nov 2018 – This report focuses on top manufacturers in Global Market.The Global Polyethylene Naphthalate Market size is expected to value at USD 1.40 billion by 2022.
Polyethylene naphthalate (PEN) is also adopted in various packaging solutions in order to improve thermal and barrier properties.Use of polyethylene naphthalate (PEN) enhances corrosion resistance by limiting oxidation.
Integration of raw material suppliers in the value chain coupled with lower manufacturing cost are some of key contributing factor for polyethylene naphthalate market expansion, in the recent years.

Global Vending Housing Market Research Report - Industry Analysis, Size, Share, Growth, Trends and Forecast Till 2027 – DecisionDatabases.comThe comprehensive value chain analysis of the market will assist in attaining better product differentiation, along with detailed understanding of the core competency of each activity involved.
The market attractiveness analysis provided in the report aptly measures the potential value of the market providing business strategists with the latest growth opportunities.
The report classifies the market into different segments.
These segments are studied in detail incorporating the market estimates and forecasts at regional and country level.
The segment analysis is useful in understanding the growth areas and probable opportunities of the market.Final Report will cover the COVID-19 Impact and Recovery on this industry.Browse the complete Global Vending Housing Market Research Report – Industry Analysis, Size, Share, Growth, Trends and Forecast Till 2027 @ https://www.decisiondatabases.com/ip/42560-vending-housing-market-reportThe report also covers the complete competitive landscape of the global Vending Housing market with company profiles of key players such as: NebrakPlatinoDupont LatourVendaidThe detailed description of each has been included, with information in terms of H.Q, future capacities, key mergers & acquisitions, financial overview, partnerships, collaborations, new product launches, new product developments and other latest industrial developments.SEGMENTATIONS IN THE REPORT: By TypeOperandi TypeOtherBy ApplicationSnack Vending MachineBeverage Vending MachineTicket Vending MachineOtherBy Geography:North America (NA) – US, Canada, and MexicoEurope (EU) – UK, Germany, France, Italy, Russia, Spain & Rest of EuropeAsia-Pacific (APAC) – China, India, Japan, South Korea, Australia & Rest of APACLatin America (LA) – Brazil, Argentina, Peru, Chile & Rest of Latin AmericaMiddle East and Africa (MEA) – Saudi Arabia, UAE, Israel, South AfricaDownload Free Sample Report of Global Vending Housing Market @ https://www.decisiondatabases.com/contact/download-sample-42560The Global Vending Housing Market has been exhibited in detail in the following chapters – Chapter 1 Vending Housing Market Preface Chapter 2 Executive Summary Chapter 3 Vending Housing Industry Analysis Chapter 4 Vending Housing Market Value Chain Analysis Chapter 5 Vending Housing Market Analysis By Type Chapter 6 Vending Housing Market Analysis By Application Chapter 7 Vending Housing Market Analysis By Geography Chapter 8 Competitive Landscape Of Vending Housing Companies Chapter 9 Company Profiles Of Vending Housing IndustryPurchase the complete Global Vending Housing Market Research Report @ https://www.decisiondatabases.com/contact/buy-now-42560Other Reports by DecisionDatabases.com:Global Pizza Vending Machine Market Research Report – Industry Analysis, Size, Share, Growth, Trends and Forecast Till 2027Global Ready To Eat Food Vending Machine Market Research Report – Industry Analysis, Size, Share, Growth, Trends and Forecast Till 2027Global Coffee Vending Machines Market Research Report – Industry Analysis, Size, Share, Growth, Trends and Forecast Till 2027About-Us: DecisionDatabases.com is a global business research reports provider, enriching decision makers and strategists with qualitative statistics.
DecisionDatabases.com is proficient in providing syndicated research report, customized research reports, company profiles and industry databases across multiple domains.Our expert research analysts have been trained to map client’s research requirements to the correct research resource leading to a distinctive edge over its competitors.

Global Feed Enzymes Market categorizes the Global Industry by Type, Livestock, Form and Region | Feed Enzymes Industry
Feed enzymes are either plant-derived or chemical ingredients used to boost the quality of the animal nutrition as well as nutritional properties of the animal fodder.
Rising health concerns is one of the major factors contributing to the growth of the global feed enzymes market.
Increased awareness about the feed enzymes has raised the bar of feed quality, which, in turn, has increased the share of global feed enzyme market.
Download free Sample Report @ https://www.marketresearchfuture.com/sample_request/5130
Key Players and Competition Analysis

According to the current analysis of Reports and Data, the global Phenoxyethanol Preservatives market was valued at USD 131.6 Million in 2019 and is expected to reach USD 203.5 Million by the year 2027, at a CAGR of 5.6%.
These antimicrobial properties against mold formation, bacteria, and yeast are expected to be one of the factors propelling the growth of the global market in the coming years.
There have been observations that though microorganisms can adapt to any environment, they are unable to adapt to the presence of phenoxyethanol preservatives, which is a factor contributing to the high demand for these preservatives from the cosmetics industry.Blended preservatives attain properties such as compatibility with proteins and nonionic compounds, low toxicity, and stability under heat and can act effectively against bacteria.
Phenoxyethanol preservatives are further used in the production of personal care and cosmetics such as ointments, detergents, cosmetics, and perfume owing to the approval for its usage as a preservative in many beauty product formulations.Request for sample copy @ https://www.reportsanddata.com/sample-enquiry-form/2480Key participants include BASF SE, Schülke & Mayr GmbH, Symrise AG, Akema Fine Chemicals S.r.l., Dow Dupont Inc., Galaxy Surfactants Ltd., Clariant AG, Ashland Global Holdings Inc., Lonza Group AG, Santa Cruz Biotechnology, Inc., Liaoning Kelong Fine Chemical Co. Ltd., Penta Manufacturing Company, Zhejiang Shengxiao Chemicals Co. Ltd., Thor Personal Care SAS, and Finetech Industry Limited among othersThe demand for cosmetics is high in countries such as China, Japan, and India, is estimated to propel the regional markets.
With the presence of several companies involved in the production of phenoxyethanol preservatives, the Asia-Pacific region will witness considerable growth throughout the predicted period.
This region is proposed to remain the dominant regional segment with a significant CAGR during 2020-2027.

The growing demand from various end users such as textiles, packaging and agriculture is expected to drive the demand for Benzene Market.Benzol Market Size – USD 82.04 Billion in 2018, Market Growth - CAGR of 3.8%, Market Trends – Rapid expansion in the APAC region.Reports and Data recently added Global Benzol Market research report to its ever expanding database that provides a thorough investigation of the market scenario of the market size, share, demand, growth, trends.
The report further offers insights about the key players, key trends, product demands, current and emerging trends, regional bifurcation, revenue growth and strategic alliances in the market.Key participants include Sinopec, BASF SE, Dow DuPont, Saudi Basic Industries Corporation, ExxonMobil Corporation, China National Petroleum Corporation, Royal Dutch Shell plc.
JX Holdings, Bp Plc., and Borealis AG, among others.Get a sample of the report @ https://www.reportsanddata.com/sample-enquiry-form/2326The report provides a complete analysis of the leading players operating in the global Benzol market along with their financial standings, company overview, business strategies, and policies.
It provides a thorough assessment of the strategic initiatives such as mergers and acquisitions, joint ventures, collaborations, partnerships, agreements, brand promotions, product launches, government and corporate deals, and product developments undertaken by the companies to gain a robust footing in the market.Regional analysis includes an in-depth study of the key geographical regions to gain a better understanding of the market and provide an accurate analysis.
It provides insights into production and consumption patterns, import/export, current and emerging trends, supply and demand, consumer demand, and presence of key players in each region.
It also offers insights about the consumer behavior, revenue growth, market share, and market size of the global Benzol market in each key region.In-depth regional analysis covers: North America (U.S., Canada, Mexico)Europe (U.K., Italy, Germany, France, Rest of EU)Asia Pacific (India, Japan, China, South Korea, Australia, Rest of APAC)Latin America (Chile, Brazil, Argentina, Rest of Latin America)Middle East & Africa (Saudi Arabia, U.A.E., South Africa, Rest of MEA)To know more about the report @ https://www.reportsanddata.com/report-detail/benzene-marketBenzol Market Segmentation:Derivative Outlook (Revenue, USD Billion; Volume, Kilo Tons; 2016-2027)CumeneAnilineEthylbenzeneCyclohexaneChlorobenzeneMaleic AnhydrideAlkylbenzeneManufacturing Process Outlook (Revenue, USD Billion; Volume, Kilo Tons; 2016-2027)Catalytic ReformingToluene disproportionationToluene hydrodealkylationPyrolysis Steam Cracking of NaphthaFrom BiomassApplication Outlook (Revenue, USD Billion; Volume, Kilo Tons; 2016-2027)PlasticsSolventChemical IntermediatesSurfactantsRubber ManufacturingDetergentsExplosivesLubricantsPesticidesOthersEnd-Users Outlook (Revenue, USD Billion; Volume, Kilo Tons; 2016-2027)PackagingPharmaceuticalsAgricultureConstructionsTextilesOthersAdditionally, the report is furnished with the analytical data obtained from SWOT analysis, Porter’s Five Forces Analysis, feasibility analysis, and investment return analysis.

Industrial Forecast on Agricultural Adjuvants Market: The report comprises of a comprehensive analysis of the Agricultural Adjuvants Market on a Global and Regional basis.
Global Agricultural Adjuvants Market is expected to register a strong CAGR in the Forecast Period 2021 to 2029.
In addition, this report consists of an in-depth study of potential opportunities available in the market on a global level.The Global Agricultural Adjuvants market report provides a holistic view of the global market, which includes significant insights for business strategies.
It includes a brief summary of the market, including the latest trends, market size and share, growth rate, revenue generation information, overall demand analysis, and forecasts.
Furthermore, a detailed description of the strategic developments and segment analysis has been provided by the research analysts.
The report determines the aggregate share market share held by the key industry participants and provides a profound view of the competitive landscape.Here, You can avail sample PDF pages and 30 mins free consultation!


